What Is That Funny Graphic Looking Thingy In Your Camera's Display?

If you have clicked to open this week's blog, then you must be part nerd.
Today I would like to briefly discuss "The Histogram", that funny graphic looking thingy you may have seen in your camera's display, and why it's one of the most important skills to master in digital photography.
So what is a Histogram? Defined simply, it is a way to sort things into groups by using some sort of grouping criteria. One example with which we are all familiar is test scores. Remember the "Bell Curve"? There were the few brains in the class who always got an A, some would get B's, most would get C's, some would get D's, and sadly there were few who got an F.
Let's use another example. Say someone gives you a large bag of assorted color marbles and will pay you $100 to determine how many there are of each color. To keep things simple, the assorted colors are: White , Red, Orange Yellow, Green, Blue, Purple and Black. So we get eight containers and label each accordingly. You put the red marbles in the container labeled "Red", the blue marbles in the container labeled "Blue", and so on. When you are done sorting you count how many marbles are in each container. What an easy way to make money.
So to repeat, a histogram is nothing more than a way of grouping objects by some sort of grouping criteria.
Are you bored yet? If not read on. We're getting to the good part.
So how does a Histogram apply to photography and why is it so important?
One of the greatest photographers of all time was Ansel Adams. His work is legendary to this day. Those familiar with his work know that he developed the "Zone System", where Zone 0 is the blackest black and Zone 10 is the whitest white. Each zone is one Exposure Value (or one f-Stop) higher than the previous. Sounds like a histogram to me, but I have greatly oversimplified this concept. To understand The Zone System thoroughly, read "The Negative" by Ansel Adams. His book is beside me as I write this blog. The zone system applies to color as well as black and white photography. So let's take this concept one step further.
Most digital cameras have a "Histogram" option that when selected, will show the Histogram for a photograph. Here's an example:
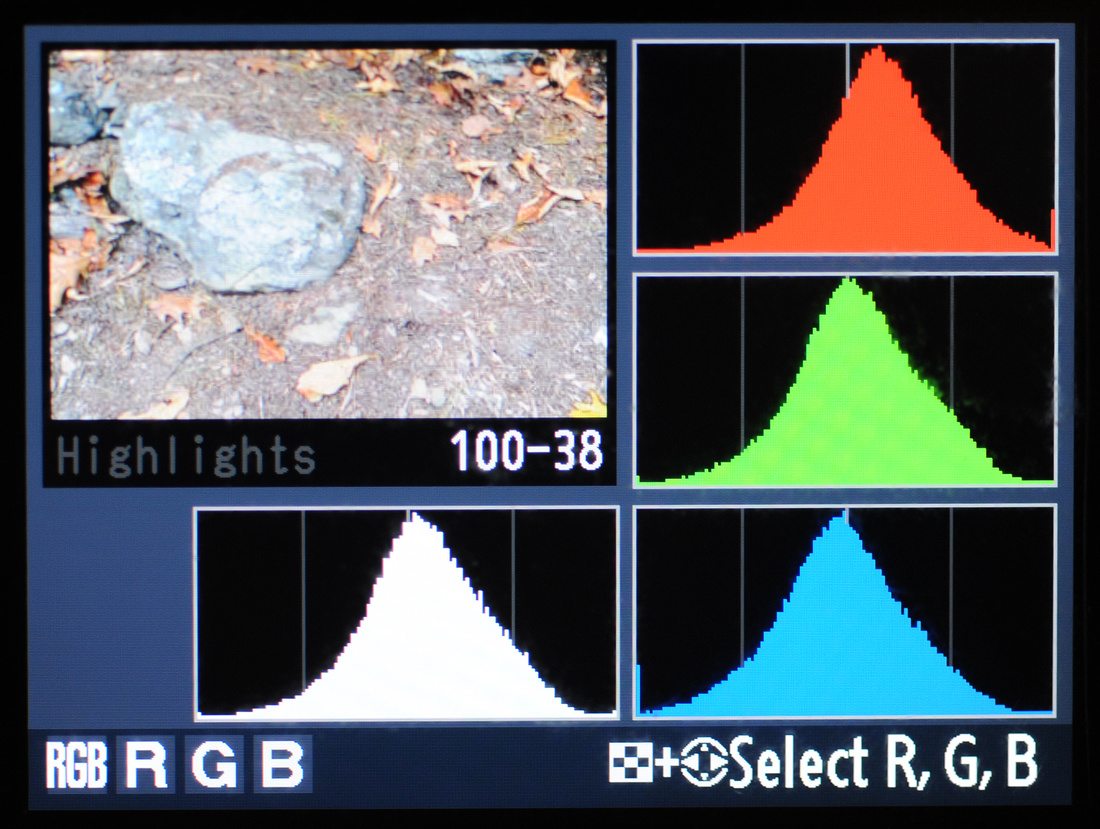

The above is a photograph of my camera's monitor display after I photographed a rock. I would have liked to have used a model but no one was interested. Even the rock had to be coerced. Anyway, the white colored histogram below the image of the rock is the RGB Histogram, which is derived from the R,G,B (Red, Green, Blue) histograms in the right side of the photograph. The RGB Histogram (the white one) is the most important and forms the basis of our analysis. So let's begin. Remember, the left side of the graph is where the darkest blacks are graphed. Conversely, the right side is where the whitest whites are graphed. If you see spikes on the extreme left or extreme right, these would indicate underexposure or overexposure respectively. Back to our analysis. Notice there is a small amount of data on the extreme left. These data correlate to the darkest shadows in the photograph, which are the shadows underneath the leaves. Conversely there is some data on the extreme right, these correlate to the bright spots on the rock. But most of the data is in the middle, which is where we want it. The bell shape of the curve in the center of the graph indicates the photograph is correctly exposed. If the peak of the curve was more towards the left, that would indicate underexposure. If the peak was more to the right, that would indicate overexpose. So, this is a properly exposed photograph of a rock and its surroundings. Lovely!
Contrast this photograph with the one below.

Oh what a mess! The photograph of the rhododendrons was taken about 15 feet from where I took the photograph of "The Rock". Note the spikes on the extreme left and extreme right indicating underexpose and overexposure. The spikes correlate to the darkest shadows under the bushes, and to the leaves that are in direct sunlight. There are some mid-ranges tones, but underexposure and overexposure dominate. Furthermore the data is skewed to the left which indicates underexposure. But a slower shutter speed would blow out even more highlights raising the spike on the extreme right. What's a photographer to do? Delete the image. This is a no-win situation called a high contrast scene. You can't correct it in Photoshop (or any other image editor) because you've lost too much data. What has actually happened is that we have greatly exceeded the dynamic range of the camera's photo sensor. More about dynamic range in another blog.
I would be lost if I was not able to use histograms. They do so much more than a light meter. I have one of those too, but it stays in my bag.
I could go on and show several more examples. But I said that I would be brief. Besides, who wants so see a photograph of a rock anyway. Can we get any more boring? And if you have read this far then I thank you for reading this nerdy prose about thingies that look like some sort of graph.
My intention today was to introduce, explain, and analyze a histogram. I pray that I have succeeded. Evaluating a histogram is one the most valuable skills one can learn in digital photography. With practice and experience, you too will learn how interpret them. Once you have mastered such, you will be well on your way to creating great photographs.
I also want to thank you for putting up with my inane attempts at humor.
Keep shooting, and read your histograms.
Until next time,
Paul